
Monster : A Centralized Monitoring System With OpenTSDB
Systems are rapidly becoming distributed in nature. Systems now a days are also implementing components which are designed to perform a specific task. With more and more components, they are spreading rapidly on different machines, different operating systems and they are altogether different in nature.
In general, if something goes down or if something is not performing well, then one need to investigate the root cause of issue so as to tune system or to fix it. In complex systems, doing such analysis might become a complex task ending up consuming lots of resources. As there are multiple components involved, there would be multiple teams involved. This further slows down the investigation process. In worst case, business might get impacted because of poor performing system for such a long time. As a solution one can implement Central Monitoring System which collects critical metrics from each of the collects. With this system in place, if something screws up, one can correlate all the events at a single location reducing the unnecessary overhead analyzing each component separately.
This article is more of a overview about how monster, our in house central monitoring system, looks like.
System Overview #
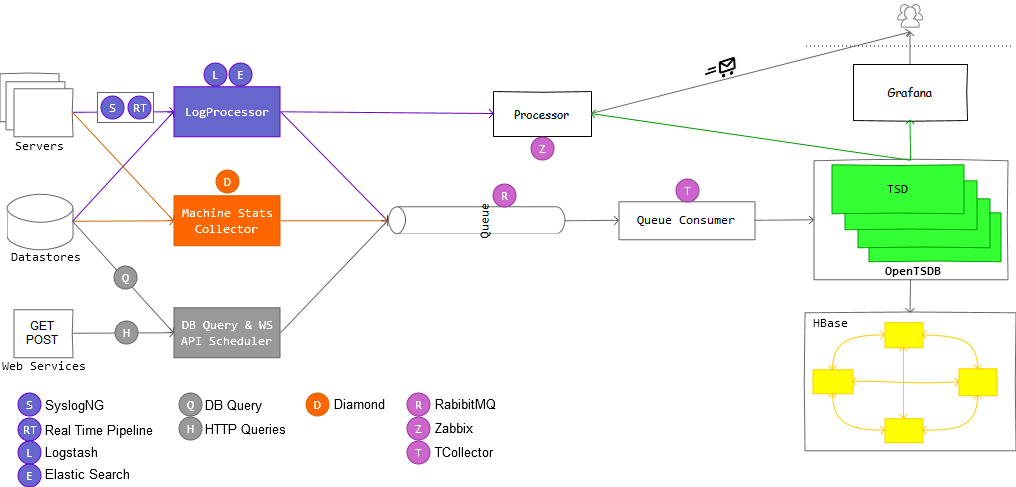
To get our monster working, we need to setup a pipeline of system components. Each system component is on specific role and has to perform some task in order to keep data points flowing. Lets peek at this pipeline.
Server #
Server is any machine that you want under monitoring. It produces three[atleast] types of metrics.
- System Metrics like CPU, Memory, etc.
- Access logs for web servers
- Application logs for deployed web apps
Datastore #
Datastore covers various components which can store data. The most important expectation from them is low latency while querying. It covers MySQL, MSSQL, Couchbase, Memcached like datastores.
- Performance Metrics like IO’s, locks, etc.
- System Metrics for DBServer
- Server logs such as slow query logs
- Certain stats which can be obtained by actually querying DB.
- Business Metrics obtained by querying DB.
Web Services #
Most of application consume data from other applications and third party through APIs. If there is some issue with these API, we can see sudden drop in funnel conversion rations and bookings. It is very important to monitor these service’s performance. A healthcheck and response time would be first class citizen for such monitoring.
DataMonster #
DataMonster is a task scheduler which we have developed in house. These tasks are configured from Django Admin UI and these tasks are executed by celery workers. Most of the tasks are queries fetching business reports and queries to ES for application & access stats.
Gathering Metrics #
Once we have identified components to be monitored, we can select/write appropriate agent/processor for getting data points in appropriate format into OpenTSDB and Zabbix.
System Metrics #
System metrics include metrics from CPU, Memory, Disk, Network, etc. For Linux machines we already have Graphite+Diamond in place. We decided to extend Diamond for pushing these stats into OpenTSDB. We wrote a custom handler to get data in proper format and that was about it. But for windows machines, we had to explore for options. Leveraging Performance monitor is on top of our mind. We would also be evaluating scollector for the very same task. UPDATE: scollector has been modified to work over TCP and it is working perfectly.
Applications Logs #
Applications produce huge amount of logs. These logs carry valuable information about errors, ambiguous conditions as well as various response codes from third party services. In order to retrieve this information from logs, these logs are collected at a location with the help of syslog ng and then passed on to ES cluster. Useful information can be queried from ES and then converted in the metric for further consumption.
Access Logs #
Every web server can be configured to produce access logs. Access logs can be used to identify bottlenecks in applications, error pages, visits, page views, downloads, keywords, referring websites, etc. In order to process these logs one has to standardize the pattern for logging. This standardization is relatively easy. Logster tuned for OpenTSDB is being planned for production usage.
Database Performance #
Database performance is measured in terms of application performance. Critical queries executed and stored procedures invoked, number of connections, transactions are important from that perspective. This data can be fetched from tables or from logs printed by those db. First class members for such monitoring are:
- Slow queries response time
- Critical queries and procedures response time as well as count
- Transactions and connections count
- Exceptions count
Caching Layer #
Most of the web applications are backed by caching systems such couchbase and memcached. It is equally important to measure the performance and throughput of this system so that we can efficiently utilize the available resources. we are as of now utilizing cbstats and memcached stat command to receive stats in out system.
Observing Trends #
One can easily observe trends from OpenTSDB’s own GUI or from Grafana. If you want to create dashboards, metrilyx can be used.
Generating Alerts #
In order to generate various alerts, we can use zabbix. Zabbix is an open source tool which has multiple components. Core component involves, zabbix server. This zabbix server has capability to create various rules on collected data and it then can send an alert to a mail group. Cool, isn’t it?